Attock Refinery vs Cnergyico: Refinery Stocks 2026
On 2 November 2026 prices, Attock Refinery scores better on our scorecard: it trades at 2.4 times trailing earnings, holds Rs 116 billion of cash and no debt, and pays a dividend. Cnergyico is cheaper on book value, at 0.3 times, but pays no dividend. Both earned far higher profits in July to September 2026 as refining margins widened.
Key takeaways
- Attock Refinery scores 7 on our six-measure scorecard (lower is better) and Cnergyico 11.
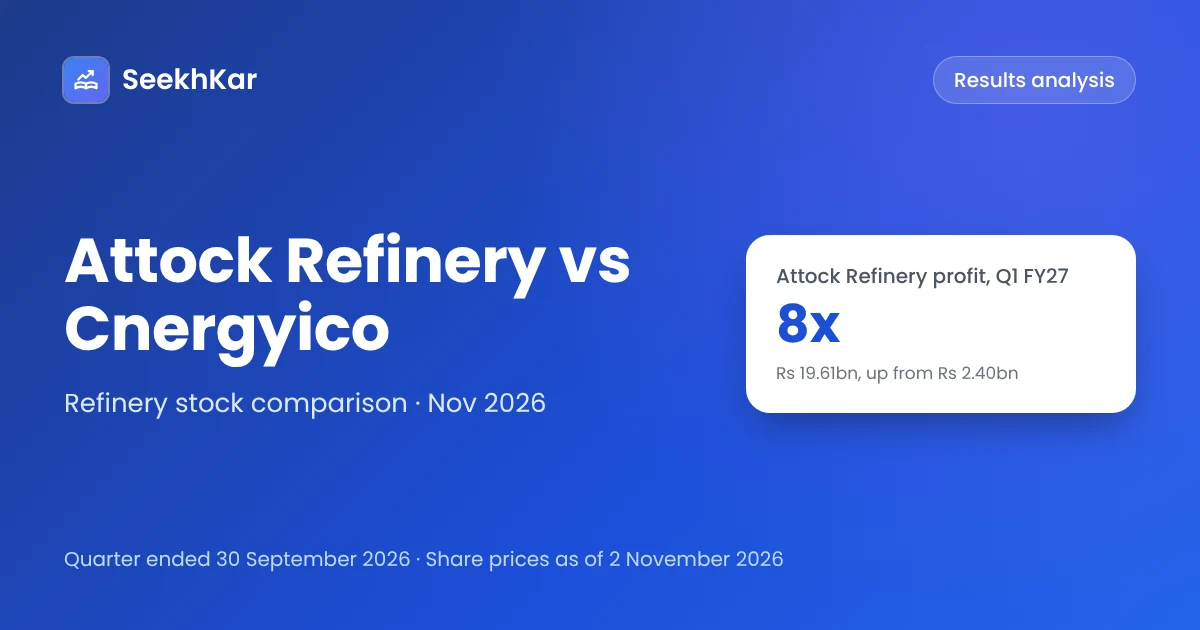
- Attock Refinery's July to September profit rose eight-fold to Rs 19.61 billion, or Rs 183.89 a share, as its gross profit rose almost 30-fold.
- Cnergyico swung from a Rs 0.79 billion loss to a Rs 12.64 billion profit in the same quarter.
- Both trade below 3 times trailing earnings, a sign the market does not expect margins this wide to last.
- Attock Refinery paid Rs 17.50 a share for FY26; Cnergyico paid no dividend.
PSX retail investor
M Zubair is a retail investor on the Pakistan Stock Exchange. He writes SeekhKar's guides to explain the basics of investing, such as reading annual reports, P/E ratios, dividends and valuation, in simple language for new PSX investors. Everything here is for learning, not investment advice.
Attock Refinery vs Cnergyico: Valuation at a Glance
Attock Refinery (ATRL) and Cnergyico PK (CNERGY) are the two oil refiners in the KSE-100. Both end their financial year on 30 June, so their results for the quarter ended 30 September 2026 (Q1 FY27) cover the same period. Prices are PSX closing prices on 2 November 2026.
Earnings are trailing twelve months (TTM): FY26 EPS, minus Q1 FY26, plus Q1 FY27. Dividends are each company's dividends for FY26.
| Metric | ATRL | CNERGY |
|---|---|---|
| Share price, 2 Nov 2026 | Rs 979.95 | Rs 12.28 |
| Market capitalisation | Rs 104 bn | Rs 67 bn |
| EPS, Q1 FY27 | Rs 183.89 | Rs 2.30 |
| EPS, TTM | Rs 405.82 | Rs 4.47 |
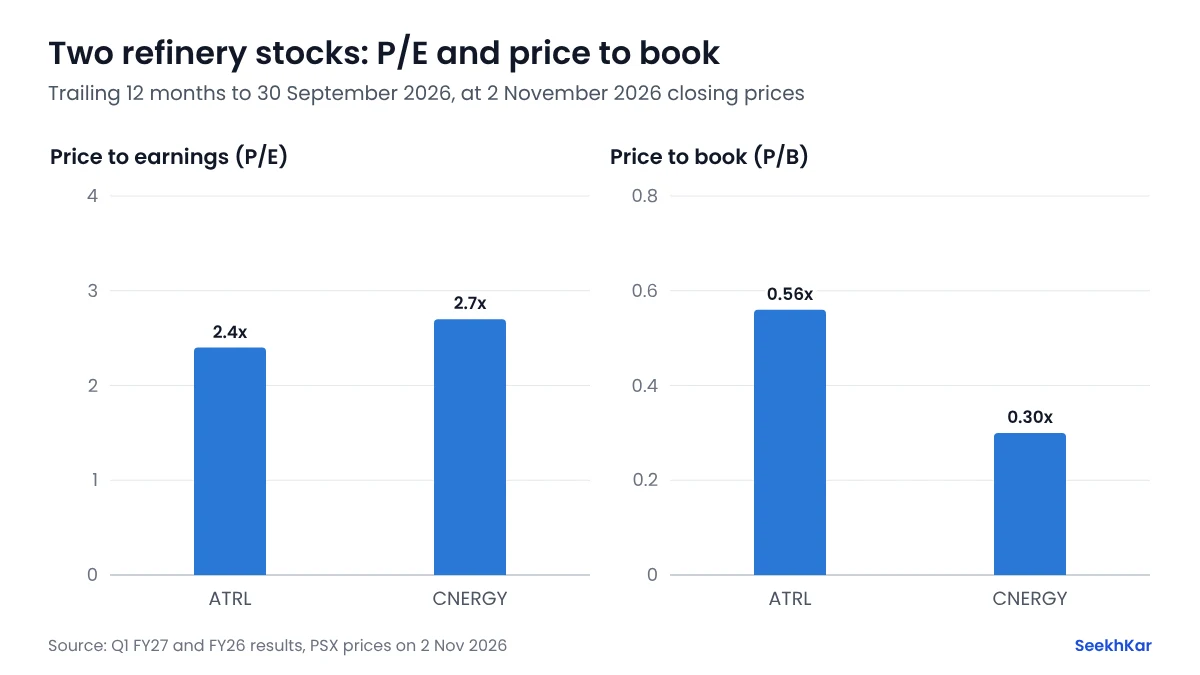
| P/E, TTM | 2.4x | 2.7x |
| Book value per share | Rs 1,748.31 | Rs 40.98 |
| P/B | 0.56x | 0.30x |
| ROE (TTM EPS ÷ book value) | 23.2% | 10.9% |
| Dividend per share, FY26 | Rs 17.50 | None |
| Dividend yield | 1.8% | 0% |
| Profit, Q1 FY27 vs Q1 FY26 | +Rs 17.2 bn | +Rs 13.4 bn |
| Net debt ÷ equity | −0.62x | 0.07x |
Book values, debt and cash are from S&P Global data: Attock Refinery's at 30 June 2026 and Cnergyico's at 31 March 2026, the latest available. Cnergyico's FY26 EPS (Rs 2.03) is the sum of its four quarters. Profit growth is shown in rupees because Cnergyico made a loss a year earlier, so a percentage change has no meaning. A negative net debt figure means more cash than debt.
Why Refinery Profits Jumped
A refinery earns the gap between what it pays for crude oil and what it sells petrol, diesel and other fuels for. In 2026 that gap widened sharply: fuel prices rose faster than crude. Pakistan Observer linked the wider margins to the war involving the US and Iran, which disrupted oil supplies. In April 2026 the government also moved diesel to a temporary cost-plus price formula, which The News reported narrowed, but did not close, the gap.
The result was a huge jump in refiners' profits. Attock Refinery's gross profit rose from Rs 0.99 billion to Rs 29.15 billion and Cnergyico's from Rs 0.72 billion to Rs 22.13 billion. The two refiners outside the KSE-100 did the same: Pakistan Refinery earned Rs 13.97 billion and National Refinery Rs 11.57 billion in the quarter.
That is why both stocks trade below 3 times trailing earnings. A P/E that low usually means the market expects profits to fall back; our guide to P/E ratios by sector explains why a one-off profit makes a P/E look cheap.
Q1 FY27 Results
| Quarter ended 30 Sep | Net sales, 2026 | 2025 | Profit after tax, 2026 | 2025 |
|---|---|---|---|---|
| Attock Refinery | Rs 143.88 bn | Rs 59.37 bn | Rs 19.61 bn | Rs 2.40 bn |
| Cnergyico | Rs 145.19 bn | Rs 61.61 bn | Rs 12.64 bn | −Rs 0.79 bn |
- Attock Refinery: sales more than doubled and gross profit rose almost 30-fold. Of its Rs 183.89 EPS, Rs 174.00 came from refining and Rs 9.89 from its other investments, against Rs 13.85 and Rs 8.67 a year earlier.
- Cnergyico: sales rose 136% and gross profit to Rs 22.13 billion from Rs 0.72 billion. Mettis Global cited high refinery throughput and wider crack spreads (the gap between fuel and crude prices).
Dividend History and Debt
Attock Refinery pays twice a year: Rs 5.00 (February 2025) and Rs 5.00 (October 2025) for FY25, then Rs 2.50 (March 2026) and a Rs 15.00 final (October 2026) for FY26. At 2 November prices, Rs 17.50 is a 1.8% yield, or 1.5% after the 15% tax for filers. It paid out only 7% of its FY26 EPS of Rs 244.45.
Attock Refinery has no borrowings and held Rs 116.5 billion of cash and short-term investments at 30 June 2026, more than its market value. Cnergyico paid no dividend for FY26 and had Rs 18.0 billion of debt against Rs 2.7 billion of cash at 31 March 2026. The dividend calculator works out your income after tax from any payout.
Scorecard: Which Refinery Stock?
We ranked the two companies 1 (best) or 2 on six measures, with equal weight. Profit growth is ranked on the rupee increase. A lower total is better.
| Company | P/E | P/B | Dividend yield | ROE | Profit growth | Debt | Total |
|---|---|---|---|---|---|---|---|
| Attock Refinery | 1 | 2 | 1 | 1 | 1 | 1 | 7 |
| Cnergyico | 2 | 1 | 2 | 2 | 2 | 2 | 11 |
- Cash and income: Attock Refinery. The lower P/E, the higher ROE, no debt and a dividend. The risk is that its profit depends on margins that may narrow.
- Deep discount to book: Cnergyico. It trades at 0.3 times book value. The risks are no dividend, debt, a loss in April to June 2026 and the same margin risk.
Our refinery and chemical sector guide covers the other numbers to check, and the KSE-100 comparisons page lists every sector we have compared. This comparison is educational and is not a recommendation to buy or sell any stock. Prices change daily, and we update these figures after each quarterly result.