Engro Holdings vs Arif Habib Corp: Holding Stocks 2026
On 3 November 2026 prices, Arif Habib Corporation scores better on our scorecard: it trades at 3.9 times trailing earnings and below book value, pays a 9.7% yield and has more cash than debt. Engro Holdings is far larger and earns a 19% ROE, but has paid no dividend in the last year and carries heavy group debt.
Key takeaways
- Arif Habib Corporation scores 7 on our six-measure scorecard (lower is better) and Engro Holdings 11.
- Engro Holdings' nine-month profit for its shareholders fell 25% to Rs 29.09 billion, because 2025 included large one-off gains linked to its thermal power assets.
- Engro Holdings declared no dividend in Q1 2026 because of the cash needed to buy Deodar's mobile towers, and is buying back and cancelling shares.
- Arif Habib Corporation paid a Rs 1.25 final dividend for FY26, a 9.7% yield at Rs 12.91.
- Arif Habib Corporation's consolidated Q1 FY27 EPS fell to Rs 0.67 from Rs 1.00; on its own (unconsolidated) it made a loss.
PSX retail investor
M Zubair is a retail investor on the Pakistan Stock Exchange. He writes SeekhKar's guides to explain the basics of investing, such as reading annual reports, P/E ratios, dividends and valuation, in simple language for new PSX investors. Everything here is for learning, not investment advice.
Engro Holdings vs Arif Habib Corp: Valuation at a Glance
Engro Holdings (ENGROH) and Arif Habib Corporation (AHCL) are holding companies: buying their shares gives you a slice of many businesses at once. Engro Holdings owns Engro Fertilizers, Engro Polymer & Chemicals, energy assets including Thar coal, the Engro Connect telecom towers and FrieslandCampina Engro. Arif Habib Corporation holds Fatima Fertilizer, the broker Arif Habib Limited, Aisha Steel, Sachal Energy and real estate. Prices are PSX closing prices on 3 November 2026.
Engro Holdings ends its year on 31 December and Arif Habib Corporation on 30 June. Earnings are trailing twelve months (TTM) to 30 September 2026, using consolidated profit for shareholders: 9M 2026 EPS plus October to December 2025 for Engro Holdings, and FY26 EPS minus Q1 FY26 plus Q1 FY27 for Arif Habib Corporation.
| Metric | ENGROH | AHCL |
|---|---|---|
| Share price, 3 Nov 2026 | Rs 264.88 | Rs 12.91 |
| Market capitalisation | Rs 309 bn | Rs 54 bn |
| EPS, TTM | Rs 35.64 | Rs 3.35 |
| P/E, TTM | 7.4x | 3.9x |
| Book value per share, 30 Jun 2026 | Rs 184.20 | Rs 14.91 |
| P/B | 1.44x | 0.87x |
| ROE (TTM EPS ÷ book value) | 19.3% | 22.5% |
| Dividends, last 12 months | None | Rs 1.25 |
| Dividend yield | 0% | 9.7% |
| EPS growth, latest period | −24.7% | −33.0% |
| Net debt ÷ equity, 30 Jun 2026 | 1.05x | −0.14x |
EPS growth is 9M 2026 against 9M 2025 for Engro Holdings and Q1 FY27 against Q1 FY26 for Arif Habib Corporation. Book values, debt and cash are from S&P Global data. Engro Holdings' debt is mostly in its operating companies, so we compare it with total group equity. A negative net debt figure means more cash than debt.
Which Holding Company Is Cheaper?
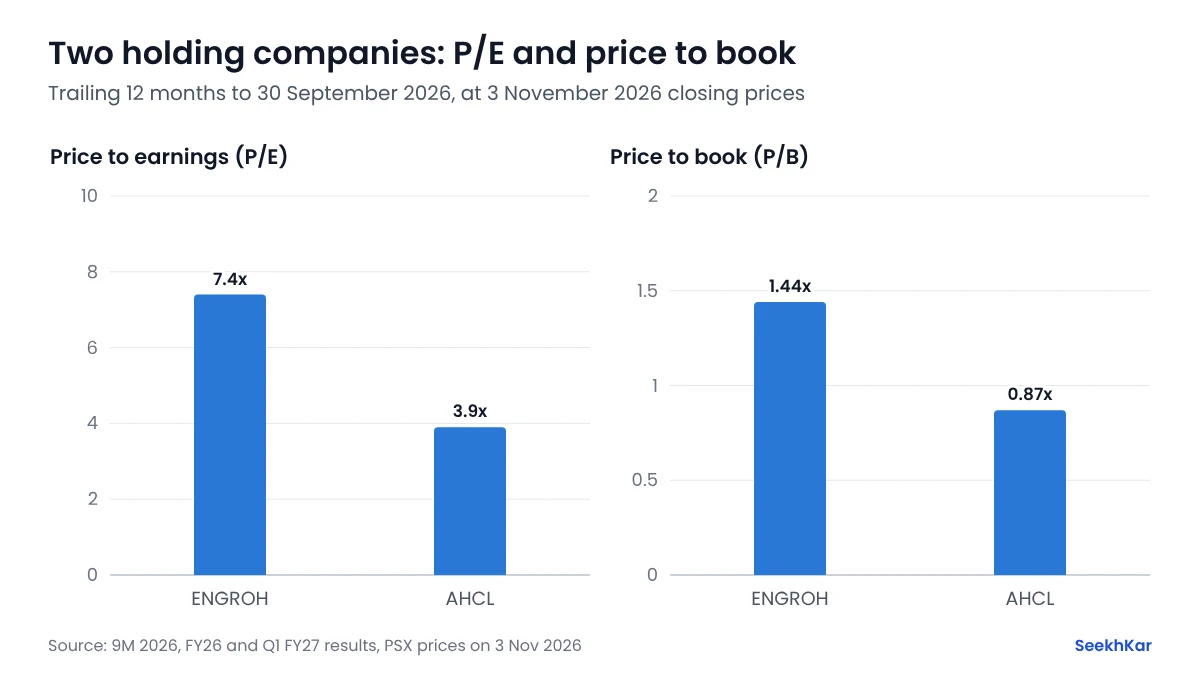
Arif Habib Corporation, on every price measure. It trades at 3.9 times trailing earnings and 0.87 times book value, against 7.4 and 1.44 for Engro Holdings, and earns a slightly higher return on its book.
Holding companies on the PSX often trade below the value of what they own, because investors cannot control how the cash is used and profits pass through several layers. Arif Habib Corporation's own (unconsolidated) profit also swings with gains and losses on its investments: it earned Rs 10.55 a share in FY26 but lost Rs 0.68 a share in Q1 FY27. Our guide to finding undervalued stocks on the PSX explains why a low P/B is only a starting point.
Latest Results
| Company | Profit for shareholders, 2026 | 2025 | Change | EPS, 2026 | 2025 |
|---|---|---|---|---|---|
| Engro Holdings (9M) | Rs 29.09 bn | Rs 38.90 bn | −25% | Rs 24.33 | Rs 32.31 |
| Arif Habib Corp (Q1 FY27) | Rs 2.82 bn | Rs 4.22 bn | −33% | Rs 0.67 | Rs 1.00 |
- Engro Holdings: revenue rose 15% to Rs 426.41 billion and gross profit 26%. Total profit fell 42% to Rs 48.42 billion because 2025 included gains of Rs 36.18 billion and Rs 24.10 billion linked to its thermal power assets; higher finance cost and levies also weighed. Its subsidiary Engro Corporation has agreed to sell 56.19% of Engro Polymer & Chemicals to Noventra for about Rs 19.7 billion, which we cover in our Lucky Core and Noventra comparison.
- Arif Habib Corporation: its FY26 consolidated profit for shareholders rose 49% to Rs 15.53 billion as Fatima Fertilizer, Arif Habib Limited and Aisha Steel did better. In Q1 FY27 it fell 33% to Rs 2.82 billion.
Dividends, Buybacks and Debt
Arif Habib Corporation paid Rs 1 for FY25 (October 2025) and Rs 1.25 for FY26 (October 2026). At Rs 12.91, Rs 1.25 is a 9.7% yield, or 8.2% after the 15% tax for filers, and only 37% of its trailing earnings. It had more cash and short-term investments (Rs 15.2 billion) than debt (Rs 5.7 billion) at 30 June 2026.
Engro Holdings has paid no cash dividend in the last twelve months, according to StockAnalysis and KseAlert. AKD Securities said it declared none with its Q1 2026 results because of the cash needed to buy Deodar's 10,600 mobile towers. It is returning cash through a buyback instead: on 4 November 2026 it cancelled 36.2 million shares it had bought back. Group debt was Rs 461.8 billion at 30 June 2026, against Rs 127.2 billion of cash. The dividend calculator works out your income after tax from any payout.
Scorecard: Which Holding Company?
We ranked the two companies 1 (best) or 2 on six measures, with equal weight. A lower total is better.
| Company | P/E | P/B | Dividend yield | ROE | EPS growth | Debt | Total |
|---|---|---|---|---|---|---|---|
| Arif Habib Corporation | 1 | 1 | 1 | 1 | 2 | 1 | 7 |
| Engro Holdings | 2 | 2 | 2 | 2 | 1 | 2 | 11 |
- Value and income: Arif Habib Corporation. The lower P/E and P/B, a 9.7% yield and net cash. The risk is profit that swings with the stock market and its investments.
- Size and spread: Engro Holdings. Fertilizer, energy, chemicals, telecom towers and dairy in one share, and a buyback. The risks are heavy group debt and no dividend while it spends on acquisitions.
Our investment and finance sector guide covers the other listed holding companies and funds, and the KSE-100 comparisons page lists every sector we have compared. This comparison is educational and is not a recommendation to buy or sell any stock. Prices change daily, and we update these figures after each quarterly result.