OGDC vs PPL vs Mari vs POL: Best E&P Stock 2026
As of 28 October 2026, Pakistan Oilfields (POL) scores best of the four E&P stocks: 5.9 times FY26 earnings excluding one-off tax reversals, a 34% return on equity and a 15.1% dividend yield. PPL and OGDC are cheapest on book value but carry large circular-debt receivables, while Mari has low receivables but the highest multiples.
Key takeaways
- FY26 profits of all four were lifted by a one-off super tax reversal worth about Rs 78 billion in total, so we compare P/E on earnings excluding it.
- POL is the cheapest on that basis at 5.9 times earnings, with the highest ROE (34%) and a 15.1% dividend yield, though it pays out 84% of earnings.
- PPL and OGDC trade below book value (0.75x and 0.86x), but PPL's trade receivables exceed its market value and OGDC's equal 48% of it.
- Mari Energies has low receivables (11% of market value) and a 22% ROE, but it is the most expensive at 10.8 times core earnings and 2.3 times book.
- In Q1 FY27 (July to September 2026), EPS rose 53% at OGDC to Rs 13.60, 45% at POL to Rs 30.10, 39% at Mari to Rs 18.13 and 26% at PPL to Rs 9.27.
PSX retail investor
M Zubair is a retail investor on the Pakistan Stock Exchange. He writes SeekhKar's guides to explain the basics of investing, such as reading annual reports, P/E ratios, dividends and valuation, in simple language for new PSX investors. Everything here is for learning, not investment advice.
OGDC vs PPL vs Mari vs POL: Valuation at a Glance
Oil & Gas Development Company (OGDC), Pakistan Petroleum Limited (PPL), Mari Energies Limited (MARI) and Pakistan Oilfields Limited (POL) are the four oil and gas exploration and production (E&P) companies in the KSE-100 index. All four close their books on 30 June, so their FY26 results cover the same twelve months, July 2025 to June 2026. Prices are PSX closing prices on 28 October 2026.
| Metric | OGDC | PPL | Mari (MARI) | POL |
|---|---|---|---|---|
| Share price, 28 Oct 2026 | Rs 303.68 | Rs 215.08 | Rs 629.73 | Rs 660.59 |
| Market capitalisation | Rs 1,306 bn | Rs 585 bn | Rs 756 bn | Rs 188 bn |
| EPS, FY26 as reported | Rs 56.35 | Rs 36.21 | Rs 72.52 | Rs 119.08 |
| EPS, FY26 excluding tax reversal (est.) | Rs 44.55 | Rs 33.23 | Rs 58.21 | Rs 112.70 |
| P/E, reported | 5.4x | 5.9x | 8.7x | 5.5x |
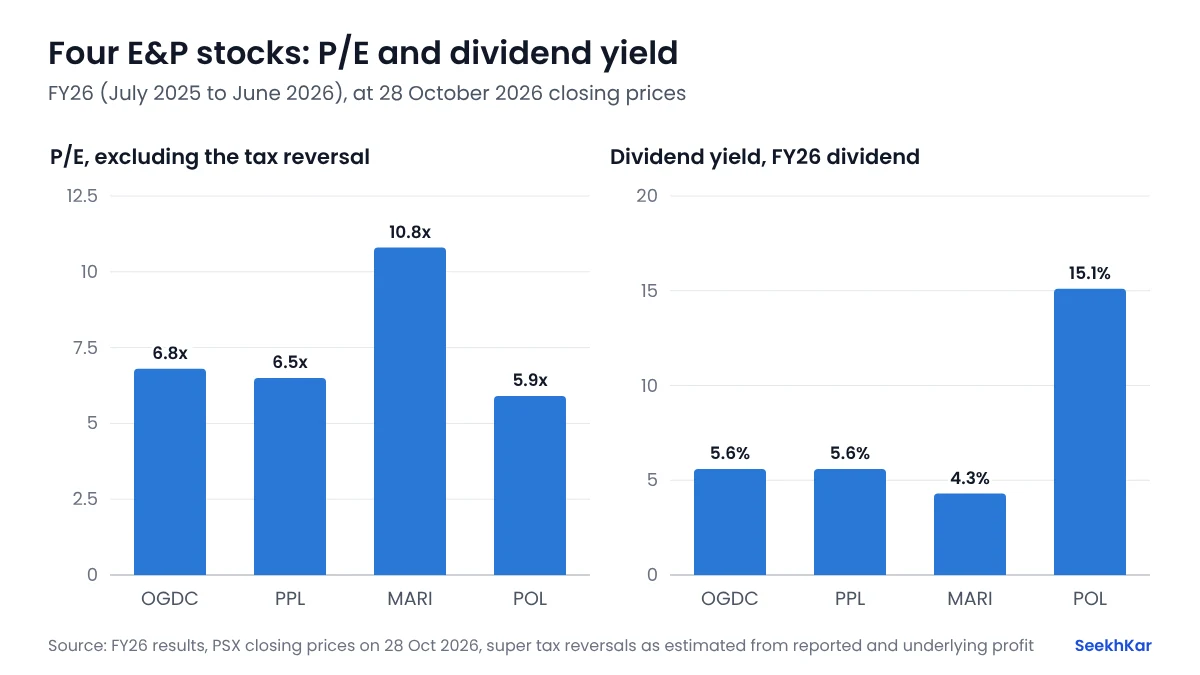
| P/E, excluding tax reversal | 6.8x | 6.5x | 10.8x | 5.9x |
| Book value per share, 30 Jun 2026 | Rs 353.21 | Rs 285.86 | Rs 268.62 | Rs 332.13 |
| P/B | 0.86x | 0.75x | 2.34x | 1.99x |
| Dividend per share, FY26 | Rs 17.00 | Rs 12.00 | Rs 27.00 | Rs 100.00 |
| Dividend yield | 5.6% | 5.6% | 4.3% | 15.1% |
| ROE, excluding tax reversal | 12.6% | 11.6% | 21.7% | 33.9% |
Book values are from S&P Global data for each company's balance sheet at 30 June 2026. "Excluding tax reversal" scales each company's reported EPS by its FY26 profit before and after the one-off super tax reversal explained in the next section. It is our estimate, not a figure the companies report.
Why FY26 Profits Overstate Earning Power: The Super Tax Reversal
After a Federal Constitutional Court ruling on 27 January 2026, E&P companies reversed super tax they had provided for in earlier years. Those reversals were booked mostly in the fourth quarter of FY26 and inflate full-year profit. They will not repeat, so a P/E on reported FY26 EPS makes these stocks look cheaper than they are.
| Company | FY26 profit, reported | Excluding reversal | Reversal (approx.) | Growth, reported | Growth, excluding reversal |
|---|---|---|---|---|---|
| OGDC | Rs 242.37 bn | Rs 191.61 bn | Rs 50.8 bn | +42.7% | +12.8% |
| PPL | Rs 98.53 bn | Rs 90.42 bn | Rs 8.1 bn | +7.1% | −1.7% |
| Mari | Rs 87.07 bn | Rs 69.89 bn | Rs 17.2 bn | +33.7% | +7.3% |
| POL | Rs 31.92 bn | Rs 30.21 bn | Rs 1.7 bn | +32.0% | +24.9% |
OGDC gained the most: about Rs 11.80 per share of its Rs 56.35 EPS came from the reversal, and its underlying profit grew 12.8% rather than 42.7%. PPL's underlying profit actually fell 1.7%. POL had the smallest reversal and the strongest underlying growth. POL's figures in this table follow the same source's basis, which is slightly lower than the Rs 33.84 billion consolidated profit POL reported.
OGDC told analysts in September 2026 that about Rs 30 billion of super tax provisions remain on its balance sheet and are under discussion with the tax authorities, so a further reversal is possible but not certain. Our guide on how to read PSX annual reports explains how to spot one-off items like this.
Which E&P Stock Is Cheapest on P/E and P/B?
On earnings, POL is cheapest at 5.9 times FY26 profit excluding the tax reversal, followed by PPL (6.5x) and OGDC (6.8x). Mari is the most expensive at 10.8x. The average of the four is 7.5x.
On book value, PPL and OGDC are cheapest. Both trade below the value of their net assets (0.75x and 0.86x), while Mari trades at 2.34x and POL at 1.99x. The reason is return on equity: POL earns about 34% a year on its equity and Mari about 22%, while OGDC and PPL earn about 12%. A company that earns more on each rupee of equity deserves a higher multiple of book value.
Part of the low ROE at OGDC and PPL comes from money they are owed but have not collected: it is funded by their equity but earns no return. The next section shows how large that is. Our oil and gas exploration sector guide explains how these companies earn money and which numbers to check.
Circular Debt: How Much Is Stuck in Receivables?
Pakistan's gas and power chain pays its suppliers late, a problem known as circular debt. E&P companies book the profit when they sell gas, but the cash can take years to arrive. Trade receivables show how much is stuck, and comparing them with market value shows how much of each share price depends on that money being paid.
| Company | Trade receivables | Per share | % of market value | Cash and short-term investments per share | % of share price |
|---|---|---|---|---|---|
| PPL | Rs 612.0 bn | Rs 225 | 105% | Rs 39 | 18% |
| OGDC | Rs 623.1 bn | Rs 145 | 48% | Rs 78 | 26% |
| POL | Rs 22.9 bn | Rs 81 | 12% | Rs 305 | 46% |
| Mari | Rs 86.0 bn | Rs 72 | 11% | Rs 50 | 8% |
Receivables are at 30 June 2026, except PPL's, which are the latest available split at 31 March 2026. PPL's receivables are larger than its entire market value, and OGDC's equal almost half of it. Investors discount those shares because they cannot be sure when, or in what form, the money will be paid. POL is the opposite case: its cash and short-term investments of about Rs 305 per share cover 46% of its share price.
Any government plan that clears circular debt would help PPL and OGDC most. Until then, their low P/B partly reflects this risk rather than a pure bargain.
Which E&P Stock Pays the Highest Dividend?
| Company | Dividend, FY26 | Yield | Yield after 15% tax | Payout of reported EPS |
|---|---|---|---|---|
| POL | Rs 100.00 | 15.1% | 12.9% | 84% |
| OGDC | Rs 17.00 | 5.6% | 4.8% | 30% |
| PPL | Rs 12.00 | 5.6% | 4.7% | 33% |
| Mari | Rs 27.00 | 4.3% | 3.6% | 37% |
POL pays by far the most. At 28 October prices, Rs 100,000 invested in POL would have earned about Rs 12,870 from its FY26 dividends after the 15% withholding tax for filers, against about Rs 4,760 from OGDC and Rs 3,640 from Mari. POL's FY26 payout included a Rs 72.50 final dividend and took 84% of its earnings, so the yield depends on oil prices and profit staying high.
OGDC, PPL and Mari pay out only about a third of their earnings, partly because circular debt limits their cash and partly to fund exploration. OGDC's FY26 dividend of Rs 17 was its highest ever, and PPL's Rs 12 was a record too. Our guide to dividend investing in Pakistan explains how to compare yields after tax.
Q1 FY27 and Production: What Has Changed Since June?
Higher oil prices have lifted E&P profits in the first quarter of FY27 (July to September 2026). POL reported Q1 EPS of Rs 30.10, up 45% from Rs 20.74 a year earlier, and Mari's EPS rose 39% to Rs 18.13 from Rs 13.03, helped by a lower tax charge (its effective tax rate fell to 22.6% from 32.2%). On 30 October 2026 OGDC reported Q1 EPS of Rs 13.60, up 53% from Rs 8.91, on revenue up 38% to Rs 132.4 billion, and declared a Rs 5 interim dividend. It also said its cash and short-term investments reached a record Rs 365.5 billion. PPL reported on 29 October 2026: Q1 EPS of Rs 9.27, up 26% from Rs 7.36, on sales up 30% to Rs 74.7 billion, below the Rs 10.81 Topline Securities had expected. PPL declared a Rs 2 interim dividend and reported two discoveries in the quarter, Dolphin X-1 and Rahi X-1.
- Prices: Topline estimated that the Arab Light benchmark averaged about $90 a barrel in Q1 FY27, and that wellhead gas prices for selected fields were revised up 8 to 10% for the first half of FY27.
- OGDC: produced 32,861 barrels of oil and 667 mmcfd of gas a day in FY26, and guided for 6 to 8% production growth in FY27, helped by the Baragzai field.
- PPL: oil output rose 22% from a year earlier to 13,024 barrels a day in the fourth quarter of FY26, with gas at 607 mmcfd.
Because oil is priced in dollars, these companies earn more when oil prices rise or the rupee weakens, and less when either moves the other way. That makes the high FY26 and Q1 FY27 profits sensitive to the Middle East situation that has kept energy prices high.
Scorecard: Which E&P Stock Looks Best Value Today?
We ranked the four companies from 1 (best) to 4 on six measures, with equal weight. P/E, ROE and growth use FY26 earnings excluding the tax reversal. A lower total is better.
| Company | P/E | P/B | Dividend yield | ROE | Growth | Receivables | Total |
|---|---|---|---|---|---|---|---|
| POL | 1 | 3 | 1 | 1 | 1 | 2 | 9 |
| OGDC | 3 | 2 | 2 | 3 | 2 | 3 | 15 |
| PPL | 2 | 1 | 3 | 4 | 4 | 4 | 18 |
| Mari | 4 | 4 | 4 | 2 | 3 | 1 | 18 |
- Best all-round: POL. Lowest core P/E, highest ROE and yield, strongest growth and little circular debt. The risks are its smaller size (about Rs 188 billion market value), its dependence on oil prices and an 84% payout that leaves little cushion.
- Largest and diversified: OGDC. Below book value with Rs 78 a share in cash and short-term investments, and production guided up 6 to 8%. The risk is Rs 145 a share of receivables.
- Deep value with the most risk: PPL. The lowest P/B of the four, but receivables exceed its market value and underlying profit fell in FY26.
- Quality at a price: Mari. Low receivables and a 22% ROE, but the highest P/E and P/B and the lowest yield.
What about DCF? An E&P company can be valued with a discounted cash flow model built on its reserves, but the result swings widely with the oil price, the rupee, reserve estimates and when receivables are collected. Our DCF calculator lets you test your own assumptions.
This comparison is educational and is not a recommendation to buy or sell any stock. Prices change daily, and we update these figures after each quarterly result.