Dolmen City REIT vs TPL REIT: REITs in Pakistan 2026
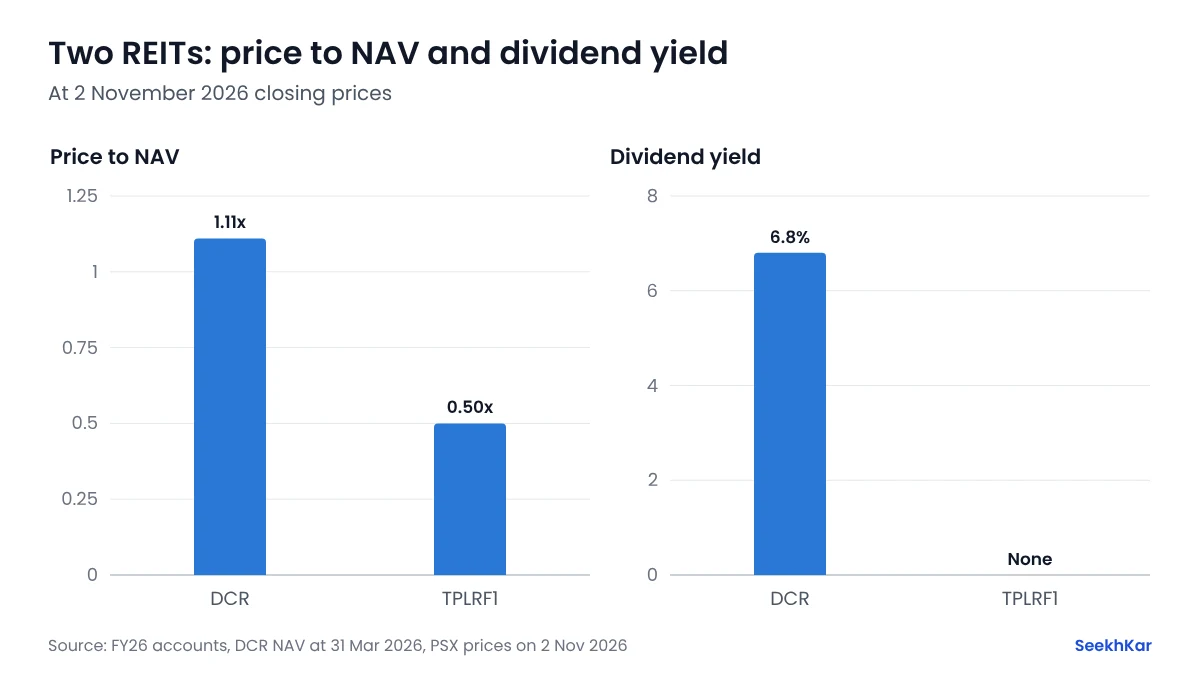
On 2 November 2026 prices, Dolmen City REIT scores better on our scorecard: it paid Rs 2.58 a unit for FY26, a 6.8% yield, earns steady rent and has no borrowings. TPL REIT trades at half its net asset value, 0.50 times, but lost Rs 0.86 a unit in FY26 and paid no dividend.
Key takeaways
- Dolmen City REIT scores 5 on our four-measure scorecard (lower is better) and TPL REIT Fund I 7.
- Dolmen City REIT paid four quarterly dividends for FY26, Rs 2.58 a unit in all, a 6.8% yield at Rs 37.93.
- Dolmen City's rental income rose 12% to Rs 6.45 billion in FY26, and its distributable income was Rs 2.57 a unit.
- TPL REIT's NAV fell to Rs 17.42 a unit at 30 June 2026 from Rs 18.28, and it recommended no dividend.
- TPL REIT trades at about half its NAV; Dolmen City at 1.1 times its March 2026 NAV.
PSX retail investor
M Zubair is a retail investor on the Pakistan Stock Exchange. He writes SeekhKar's guides to explain the basics of investing, such as reading annual reports, P/E ratios, dividends and valuation, in simple language for new PSX investors. Everything here is for learning, not investment advice.
Dolmen City REIT vs TPL REIT: Valuation at a Glance
A REIT (real estate investment trust) owns property and passes most of its income to unit holders. Dolmen City REIT (DCR), which owns Dolmen Mall Clifton and the Harbour Front office tower in Karachi, and TPL REIT Fund I (TPLRF1) are the two REITs in the KSE-100. Both end their year on 30 June. Prices are PSX closing prices on 2 November 2026.
For a REIT, the most useful measures are the price against net asset value (NAV) per unit and the dividend yield. Profits include changes in the value of the property, so a P/E can swing from year to year.
| Metric | DCR | TPLRF1 |
|---|---|---|
| Unit price, 2 Nov 2026 | Rs 37.93 | Rs 8.79 |
| Market capitalisation | Rs 84 bn | Rs 16 bn |
| NAV per unit | Rs 34.21 | Rs 17.42 |
| Price ÷ NAV | 1.11x | 0.50x |
| Earnings per unit, FY26 | Rs 5.70 | −Rs 0.86 |
| P/E, TTM | 6.6x | Loss |
| Distributable income per unit, FY26 | Rs 2.57 | n/a |
| Dividends, FY26 | Rs 2.58 | None |
| Dividend yield | 6.8% | 0% |
| Borrowings | None | Related-party loans |
Dolmen City's NAV is at 31 March 2026, the latest in its published accounts; it booked most of its Rs 6.97 billion FY26 property revaluation gain in April to June, so its June NAV will be higher. TPL REIT's NAV is at 30 June 2026 (unconsolidated; Rs 16.85 consolidated). Dolmen City's TTM earnings are FY26 EPU minus Q1 FY26 plus Q1 FY27.
Rent Versus Development
Dolmen City is an income REIT. Its income comes from rent on finished, occupied buildings. Rental income rose 12% to Rs 6.45 billion in FY26, and in the quarter to September 2026 its profit rose 7% to Rs 1.48 billion (Rs 0.67 a unit). It pays out almost all of its distributable income every quarter.
TPL REIT invests mostly in development projects. Its value depends on property that is still being built and sold, so its income is uneven. It lost Rs 1.58 billion in FY26 (Rs 0.86 a unit) against a Rs 0.76 billion profit in FY25, and its NAV per unit fell 4.7%. Its consolidated accounts also include a Rs 1.52 billion loss on remeasuring assets it holds for sale. The market prices it at about half its NAV.
Our guide to dividend investing in Pakistan explains how REIT income fits into an income portfolio.
Dolmen City REIT Dividend History
Dolmen City pays every quarter. For FY26 it paid Rs 0.63 (October 2025), Rs 0.63 (December 2025), Rs 0.66 (April 2026) and Rs 0.66 (July 2026): Rs 2.58 a unit, against distributable income of Rs 2.57. For FY25 its distributable income was Rs 2.21 a unit. It declared another Rs 0.66 for the first quarter of FY27 on 30 October 2026.
At Rs 37.93, Rs 2.58 a year is a 6.8% yield. TPL REIT recommended no dividend for FY26 or for the quarter to September 2026. The dividend calculator shows what any payout is worth after tax.
Scorecard: Which REIT?
For REITs we use four measures, with equal weight: price to NAV, dividend yield, earnings per unit and borrowings. A lower total is better.
| REIT | Price ÷ NAV | Dividend yield | Earnings | Borrowings | Total |
|---|---|---|---|---|---|
| Dolmen City REIT | 2 | 1 | 1 | 1 | 5 |
| TPL REIT Fund I | 1 | 2 | 2 | 2 | 7 |
- Steady income: Dolmen City REIT. A 6.8% yield paid quarterly from rent, and no borrowings. The risk is that its income depends on one mall and one office tower in Karachi.
- Deep discount: TPL REIT Fund I. It trades at half its NAV. The risks are losses, no dividend and a value that depends on projects being completed and sold.
Our investment and finance sector guide covers the other listed funds and finance companies. This comparison is educational and is not a recommendation to buy or sell any security. Prices change daily, and we update these figures after each quarterly result.