Interloop vs Nishat Mills: Textile Stocks 2026
On 2 November 2026 prices, Nishat Mills scores better on our scorecard: it trades at 6.9 times trailing earnings and 0.28 times book value, and its Q1 FY27 profit doubled. Interloop earns a much higher return on its book (22% against 4%) and pays more, a 4.2% yield, but costs 9.5 times earnings and carries more debt.
Key takeaways
- Nishat Mills scores 8 on our six-measure scorecard (lower is better) and Interloop 10.
- Interloop's Q1 FY27 profit rose 54% to Rs 4.23 billion, helped by higher sales and other income that more than doubled.
- Nishat Mills' own (unconsolidated) Q1 FY27 profit doubled to Rs 1.58 billion as sales rose 16%.
- Nishat Mills trades at 0.28 times its unconsolidated book value but earns only 4% on it.
- Interloop's net debt is 1.3 times its equity, more than twice Nishat Mills' 0.58 times.
PSX retail investor
M Zubair is a retail investor on the Pakistan Stock Exchange. He writes SeekhKar's guides to explain the basics of investing, such as reading annual reports, P/E ratios, dividends and valuation, in simple language for new PSX investors. Everything here is for learning, not investment advice.
Interloop vs Nishat Mills: Valuation at a Glance
Interloop (ILP) and Nishat Mills (NML) are the two largest textile companies in the KSE-100 by sales. Interloop exports socks, denim and activewear; Nishat Mills is a spinning, weaving, home textiles and garments group. Both end their year on 30 June, so their results for the quarter ended 30 September 2026 (Q1 FY27) cover the same period. Prices are PSX closing prices on 2 November 2026.
Earnings are trailing twelve months (TTM): FY26 EPS, minus Q1 FY26, plus Q1 FY27. Interloop's figures are consolidated. Nishat Mills' are unconsolidated (the company on its own), because its reported FY26 full-year figures are on that basis.
| Metric | ILP | NML |
|---|---|---|
| Share price, 2 Nov 2026 | Rs 95.84 | Rs 122.90 |
| Market capitalisation | Rs 134 bn | Rs 43 bn |
| EPS, Q1 FY27 | Rs 3.03 | Rs 4.48 |
| EPS, TTM | Rs 10.13 | Rs 17.87 |
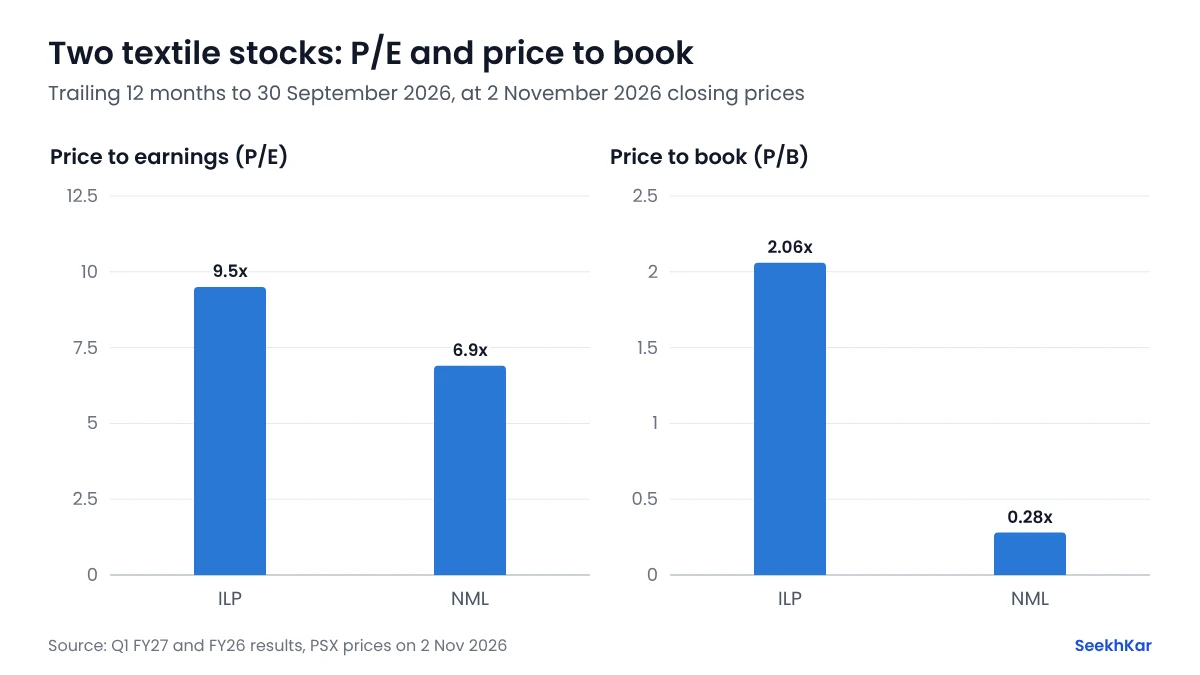
| P/E, TTM | 9.5x | 6.9x |
| Book value per share, 30 Jun 2026 | Rs 46.42 | Rs 443.87 |
| P/B | 2.06x | 0.28x |
| ROE (TTM EPS ÷ book value) | 21.8% | 4.0% |
| Dividend per share, FY26 | Rs 4.00 | Rs 2.00 |
| Dividend yield | 4.2% | 1.6% |
| EPS growth, Q1 FY27 vs Q1 FY26 | +54.6% | +103.6% |
| Net debt ÷ equity, 30 Jun 2026 | 1.30x | 0.58x |
Interloop's book value and debt are from S&P Global data; Nishat Mills' are from its Q1 FY27 accounts (unconsolidated). On a consolidated basis Nishat Mills' Q1 FY27 EPS was Rs 7.01, against Rs 4.00 a year earlier.
Which Textile Stock Is Cheaper?
Nishat Mills, by a wide margin on book value. Its unconsolidated book value is Rs 156 billion, more than three times its market value, and it trades at 6.9 times trailing earnings against 9.5 for Interloop.
The catch is how little that book earns: 4% a year, against 22% for Interloop. Nishat Mills' book value includes its long-term investments in other companies, and a low P/B often goes with a low ROE. Our guide to finding undervalued stocks on the PSX explains why a low P/B alone is not a reason to buy.
Q1 FY27 Results
| Quarter ended 30 Sep | Net sales, 2026 | 2025 | Profit after tax, 2026 | 2025 | Change |
|---|---|---|---|---|---|
| Interloop | Rs 50.75 bn | Rs 45.20 bn | Rs 4.23 bn | Rs 2.74 bn | +54% |
| Nishat Mills | Rs 52.37 bn | Rs 45.01 bn | Rs 1.58 bn | Rs 0.77 bn | +104% |
- Interloop: sales rose 12% and gross profit 10% to Rs 11.54 billion. Other income more than doubled to Rs 1.71 billion and finance cost fell 8%, which is why profit grew faster than sales.
- Nishat Mills: sales rose 16% and gross profit 28% to Rs 6.33 billion, and other income rose to Rs 1.86 billion. Its FY26 profit had fallen 9% to Rs 5.48 billion.
Dividend History and Debt
- Interloop: Rs 1 for FY25 (October 2025), then Rs 4 for FY26: a Rs 2 interim (February 2026) and a Rs 2 final. At 2 November prices, Rs 4 is a 4.2% yield, or 3.5% after the 15% tax for filers.
- Nishat Mills: a Rs 2 final for FY25 and a Rs 2 final for FY26, a 1.6% yield. It declared no interim dividend with its Q1 FY27 results.
Both carry large borrowings. Interloop had Rs 85.6 billion of debt at 30 June 2026, 1.3 times its equity after cash; Nishat Mills had Rs 91.4 billion, 0.58 times its larger equity. The dividend calculator works out your income after tax from any payout.
Scorecard: Which Textile Stock?
We ranked the two companies 1 (best) or 2 on six measures, with equal weight. A lower total is better.
| Company | P/E | P/B | Dividend yield | ROE | EPS growth | Debt | Total |
|---|---|---|---|---|---|---|---|
| Nishat Mills | 1 | 1 | 2 | 2 | 1 | 1 | 8 |
| Interloop | 2 | 2 | 1 | 1 | 2 | 2 | 10 |
- Asset value: Nishat Mills. A very low price to book, the lower P/E and the faster growth this quarter. The risk is a 4% ROE and a small dividend.
- Returns and income: Interloop. A 22% ROE and the higher yield. The risks are the higher price and the most debt.
Our textile sector guide covers the other numbers to check, such as export orders, cotton prices and the rupee, and the KSE-100 comparisons page lists every sector we have compared. This comparison is educational and is not a recommendation to buy or sell any stock. Prices change daily, and we update these figures after each quarterly result.