Millat vs Atlas Honda vs Ghandhara: Auto Stocks 2026
On 2 November 2026 prices, Ghandhara Industries scores best on our scorecard: it is the cheapest at 6.2 times earnings and grew profit 65% in Q1 FY27, but pays only a 1% yield. Atlas Honda holds the most net cash and yields 6.8%. Millat Tractors pays the highest yield, 7.5%, but carries the most debt.
Key takeaways
- Ghandhara Industries scores 11 on our six-measure scorecard (lower is better), Atlas Honda 12 and Millat Tractors 13.
- Ghandhara's Q1 FY27 profit rose 65% to Rs 2.59 billion on 58% higher sales, and it trades at 6.2 times trailing earnings.
- Atlas Honda earned Rs 11.53 billion in the half year to September, up 20%, declared a Rs 56 interim dividend and holds about Rs 64 billion of cash.
- Millat Tractors' Q1 FY27 profit rose 53%; it paid Rs 21 a share for FY26, a 7.5% yield, which is all of its trailing earnings.
- Millat is the only one of the three with net debt, about 0.86 times its equity.
PSX retail investor
M Zubair is a retail investor on the Pakistan Stock Exchange. He writes SeekhKar's guides to explain the basics of investing, such as reading annual reports, P/E ratios, dividends and valuation, in simple language for new PSX investors. Everything here is for learning, not investment advice.
Millat vs Atlas Honda vs Ghandhara: Valuation at a Glance
Millat Tractors (MTL), Atlas Honda (ATLH) and Ghandhara Industries (GHNI) are three KSE-100 vehicle makers that do not sell cars: Millat makes Massey Ferguson tractors, Atlas Honda makes Honda motorcycles and Ghandhara Industries assembles Isuzu trucks and pickups. Prices are PSX closing prices on 2 November 2026.
Millat and Ghandhara end their financial year on 30 June and Atlas Honda on 31 March. Earnings are trailing twelve months (TTM) to 30 September 2026 for all three: FY26 EPS minus Q1 FY26 plus Q1 FY27 for Millat and Ghandhara, and FY26 EPS minus the first half of FY26 plus the first half of FY27 for Atlas Honda.
| Metric | MTL | ATLH | GHNI |
|---|---|---|---|
| Share price, 2 Nov 2026 | Rs 280.71 | Rs 1,652.76 | Rs 1,160.61 |
| Market capitalisation | Rs 109 bn | Rs 205 bn | Rs 49 bn |
| EPS, TTM | Rs 21.05 | Rs 185.58 | Rs 186.48 |
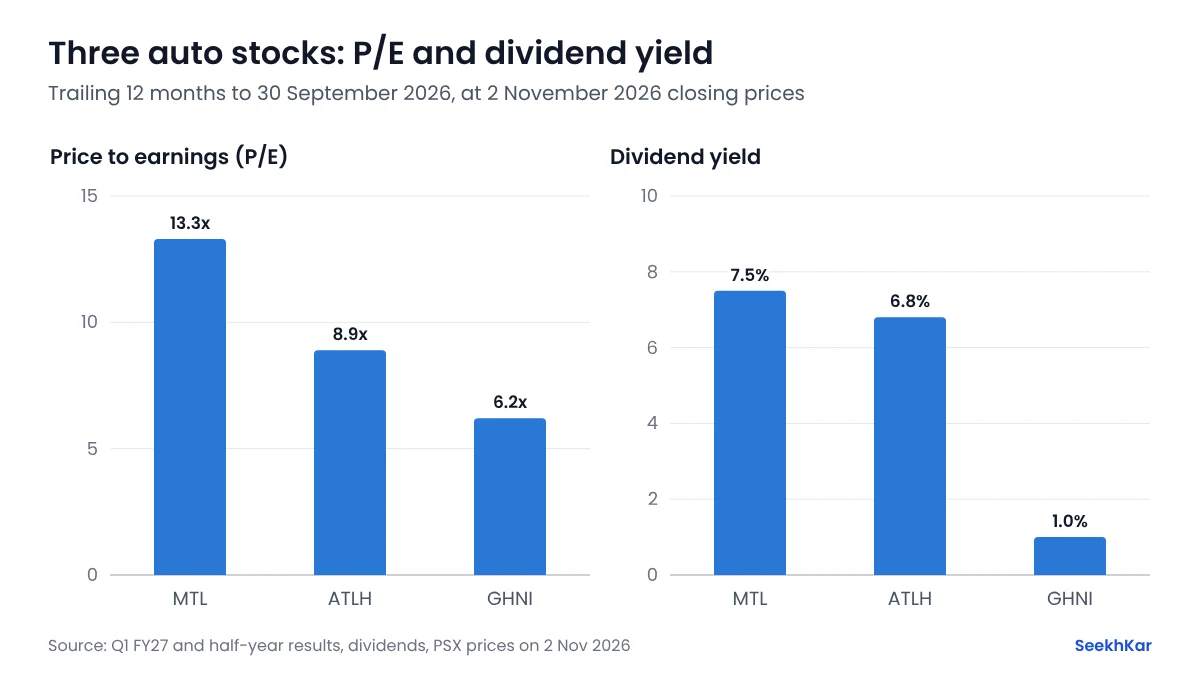
| P/E, TTM | 13.3x | 8.9x | 6.2x |
| Book value per share | Rs 25.70 | Rs 367.33 | Rs 431.63 |
| P/B | 10.92x | 4.50x | 2.69x |
| ROE (TTM EPS ÷ book value) | 81.9% | 50.5% | 43.2% |
| Dividends, last 12 months | Rs 21.00 | Rs 112.00 | Rs 12.00 |
| Dividend yield | 7.5% | 6.8% | 1.0% |
| EPS growth, latest period | +53.2% | +19.8% | +64.7% |
| Net debt ÷ equity | 0.86x | −1.39x | −0.63x |
Book value and debt are from S&P Global data at 30 June 2026, except Ghandhara's, which are at 31 March 2026, the latest available. EPS growth is Q1 FY27 against Q1 FY26, and the half year to September for Atlas Honda. A negative net debt figure means more cash than debt.
Which Auto Stock Is Cheapest?
Ghandhara Industries, by a distance. It trades at 6.2 times trailing earnings and 2.7 times book, against 8.9 and 4.5 for Atlas Honda and 13.3 and 10.9 for Millat. It is also the fastest-growing of the three.
Millat's high price to book comes from how much it pays out: it pays almost all of its profit as dividends, so its book value is small and its ROE is 82%. Atlas Honda sits in between, with a 51% ROE and more cash than any other company here. Our guide to finding undervalued stocks on the PSX explains why a low P/E is only a starting point.
Latest Results: Q1 FY27 and Half Year
| Company | Net sales, 2026 | 2025 | Profit after tax, 2026 | 2025 | Change |
|---|---|---|---|---|---|
| Atlas Honda (Apr–Sep) | Rs 161.71 bn | Rs 125.34 bn | Rs 11.53 bn | Rs 9.62 bn | +20% |
| Ghandhara (Jul–Sep) | Rs 18.89 bn | Rs 11.92 bn | Rs 2.59 bn | Rs 1.58 bn | +65% |
| Millat (Jul–Sep) | Rs 11.11 bn | Rs 7.78 bn | Rs 0.94 bn | Rs 0.61 bn | +53% |
- Ghandhara Industries: sales rose 58% and gross profit 65% to Rs 4.69 billion, so margins improved as volumes grew.
- Millat Tractors: sales rose 43% and gross profit 43% to Rs 3.12 billion. July to September was also its smallest quarter in FY26, when it earned Rs 1.54 a share in the first quarter and Rs 20.23 in the full year.
- Atlas Honda: sales rose 29% but gross profit 18% to Rs 18.77 billion, so its gross margin slipped from 12.7% to 11.6%. EPS for the half year was Rs 92.88, against Rs 77.51.
Dividend History and Yield
| Company | Last 12 months | Yield | Yield after 15% tax | Payout of TTM EPS |
|---|---|---|---|---|
| Millat Tractors | Rs 21.00 | 7.5% | 6.4% | 100% |
| Atlas Honda | Rs 112.00 | 6.8% | 5.8% | 60% |
| Ghandhara Industries | Rs 12.00 | 1.0% | 0.9% | 6% |
- Millat Tractors: Rs 10 interim (March 2026) and Rs 11 final (October 2026) for FY26.
- Atlas Honda: pays twice a year. Rs 46 (November 2025) and Rs 56 (June 2026) for FY26, then a Rs 56 interim for FY27 declared on 30 October 2026. The twelve-month figure above is the FY26 final plus the new interim.
- Ghandhara Industries: a Rs 12 final for FY26 (October 2026), after Rs 10 for FY25.
At 2 November prices, Rs 100,000 in Atlas Honda would have earned about Rs 5,800 in the last year after the 15% tax for filers. The dividend calculator works this out for any stock and amount.
Scorecard: Best Auto Stock on the PSX?
We ranked the three companies 1 (best) to 3 on six measures, with equal weight. A lower total is better.
| Company | P/E | P/B | Dividend yield | ROE | EPS growth | Debt | Total |
|---|---|---|---|---|---|---|---|
| Ghandhara Industries | 1 | 1 | 3 | 3 | 1 | 2 | 11 |
| Atlas Honda | 2 | 2 | 2 | 2 | 3 | 1 | 12 |
| Millat Tractors | 3 | 3 | 1 | 1 | 2 | 3 | 13 |
- Value and growth: Ghandhara Industries. The lowest P/E and P/B and 65% profit growth. The risks are a 1% yield and a business tied to truck and pickup demand.
- Balance: Atlas Honda. A 6.8% yield, a 51% ROE and the most cash. The risk is slower growth and a slipping margin.
- Income: Millat Tractors. The highest yield and ROE. The risks are the highest P/E, a 100% payout and net debt, in a business that depends on farm incomes.
Our automobile sector guide covers the other things to check, such as monthly sales volumes, the rupee and car financing rates, and the KSE-100 comparisons page lists every sector we have compared. This comparison is educational and is not a recommendation to buy or sell any stock. Prices change daily, and we update these figures after each quarterly result.