Cherat vs Bestway vs Kohat Cement: Cement Stocks 2026
On 2 November 2026 prices, Kohat Cement and Cherat Cement tie on our scorecard: both trade at 7.1 times trailing earnings and 1.33 times book value, with little debt. Bestway grew fastest, with EPS up 24% in Q1 FY27, and yields 8.8%, but it costs 10 times earnings and carries the most debt. Kohat pays no dividend.
Key takeaways
- Kohat Cement and Cherat Cement tie at 11 on our six-measure scorecard (lower is better); Bestway Cement scores 12.
- Bestway's first-quarter profit rose 24% to Rs 6.84 billion as sales grew 25% and gross profit 41%.
- Bestway paid Rs 40 a share for FY26 in four payments of Rs 10, an 8.8% yield, but that is 89% of its trailing earnings and it has the most debt of the three.
- Kohat Cement grew sales 15% and profit 13% in Q1 FY27 and has almost no net debt, but S&P Global data show no dividend in the last twelve months.
- Cherat Cement had the least debt and cut its finance cost by half, but its sales rose only 2% and profit 6%.
PSX retail investor
M Zubair is a retail investor on the Pakistan Stock Exchange. He writes SeekhKar's guides to explain the basics of investing, such as reading annual reports, P/E ratios, dividends and valuation, in simple language for new PSX investors. Everything here is for learning, not investment advice.
Cherat vs Bestway vs Kohat: Valuation at a Glance
Cherat Cement (CHCC), Bestway Cement (BWCL) and Kohat Cement (KOHC) are three of the KSE-100's northern cement makers, after the four larger ones in our Lucky, Fauji, Maple Leaf and DG Khan comparison. All end their financial year on 30 June, so their results for the quarter ended 30 September 2026 (Q1 FY27) cover the same period. Prices are PSX closing prices on 2 November 2026.
Earnings are trailing twelve months (TTM): FY26 EPS, minus Q1 FY26, plus Q1 FY27. Dividends are each company's dividends for FY26.
| Metric | CHCC | BWCL | KOHC |
|---|---|---|---|
| Share price, 2 Nov 2026 | Rs 270.96 | Rs 452.70 | Rs 84.99 |
| Market capitalisation | Rs 53 bn | Rs 270 bn | Rs 78 bn |
| EPS, Q1 FY27 | Rs 11.44 | Rs 11.47 | Rs 3.60 |
| EPS, TTM | Rs 37.99 | Rs 45.13 | Rs 12.03 |
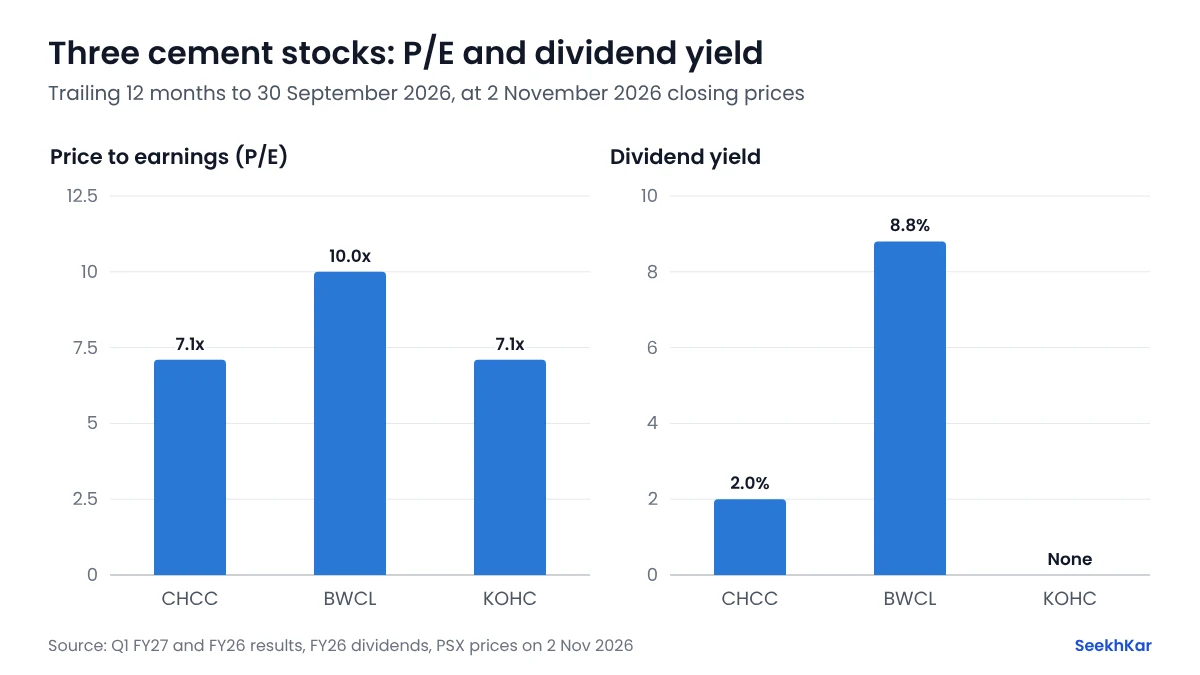
| P/E, TTM | 7.1x | 10.0x | 7.1x |
| Book value per share, 30 Jun 2026 | Rs 203.37 | Rs 226.34 | Rs 63.87 |
| P/B | 1.33x | 2.00x | 1.33x |
| ROE (TTM EPS ÷ book value) | 18.7% | 19.9% | 18.8% |
| Dividend per share, FY26 | Rs 5.50 | Rs 40.00 | None |
| Dividend yield | 2.0% | 8.8% | 0% |
| EPS growth, Q1 FY27 vs Q1 FY26 | +6.0% | +24.4% | +12.5% |
| Net debt ÷ equity, 30 Jun 2026 | 0.05x | 0.40x | 0.08x |
Book values, debt and cash are from S&P Global data at 30 June 2026. Kohat's figures are consolidated.
Which Cement Stock Is Cheapest?
Cherat and Kohat cost the same; Bestway costs more. Both Cherat and Kohat trade at 7.1 times trailing earnings and 1.33 times book value, and both earn about 19% on their book. Bestway trades at 10.0 times earnings and 2.0 times book.
Bestway's premium comes with the fastest growth, the highest ROE (19.9%) and a large dividend. Part of its profit also comes from its share in associated companies: Rs 2.96 billion in the quarter, down from Rs 3.40 billion. Our guide to finding undervalued stocks on the PSX explains why a low P/E is only a starting point.
Q1 FY27 Results
| Quarter ended 30 Sep | Net sales, 2026 | 2025 | Profit after tax, 2026 | 2025 | Change |
|---|---|---|---|---|---|
| Bestway Cement | Rs 32.30 bn | Rs 25.89 bn | Rs 6.84 bn | Rs 5.50 bn | +24% |
| Kohat Cement | Rs 11.84 bn | Rs 10.29 bn | Rs 3.31 bn | Rs 2.94 bn | +13% |
| Cherat Cement | Rs 10.51 bn | Rs 10.29 bn | Rs 2.22 bn | Rs 2.10 bn | +6% |
- Bestway: sales rose 25% and gross profit 41% to Rs 10.14 billion, and finance cost fell to Rs 1.25 billion from Rs 1.41 billion. Higher operating expenses and a smaller share of associates' profit held growth back.
- Kohat: sales rose 15% and gross profit 40% to Rs 4.95 billion. Other income fell 36% and tax rose, so profit grew 13%.
- Cherat: sales rose 2% and gross profit was flat at Rs 3.76 billion. Finance cost fell 51% to Rs 47 million, and other income rose 16%.
Dividends and Debt
| Company | FY26 dividend | Yield | Yield after 15% tax | Payout of TTM EPS |
|---|---|---|---|---|
| Bestway Cement | Rs 40.00 | 8.8% | 7.5% | 89% |
| Cherat Cement | Rs 5.50 | 2.0% | 1.7% | 14% |
| Kohat Cement | None | 0% | 0% | 0% |
Bestway is the income stock. It paid four dividends of Rs 10 for FY26, and at 2 November prices Rs 100,000 in Bestway would have earned about Rs 7,500 after the 15% tax for filers. It pays out most of its earnings while carrying Rs 55.5 billion of debt at 30 June 2026, about 0.4 times its equity after cash.
Cherat paid a Rs 1.50 interim and a Rs 4.00 final dividend for FY26 and keeps most of its profit. Kohat has almost no net debt but S&P Global data show no dividend in the last twelve months. The dividend calculator works out your income after tax from any of these payouts.
Scorecard: Which Cement Stock?
We ranked the three companies 1 (best) to 3 on six measures, with equal weight, as in our larger cement comparison. Cherat and Kohat tie on P/E and P/B, so both rank 1 there. A lower total is better.
| Company | P/E | P/B | Dividend yield | ROE | EPS growth | Debt | Total |
|---|---|---|---|---|---|---|---|
| Kohat Cement | 1 | 1 | 3 | 2 | 2 | 2 | 11 |
| Cherat Cement | 1 | 1 | 2 | 3 | 3 | 1 | 11 |
| Bestway Cement | 3 | 3 | 1 | 1 | 1 | 3 | 12 |
- Growth at a fair price: Kohat Cement. 7.1 times earnings, 13% profit growth and little debt. The risk is that it pays no dividend.
- The cleanest balance sheet: Cherat Cement. The same price as Kohat and the least debt. The risk is slow growth.
- Income and growth: Bestway Cement. The fastest growth, the highest ROE and an 8.8% yield. The risks are a premium price, an 89% payout and the most debt.
Our cement sector guide lists the other numbers to check, such as dispatches, coal costs and capacity. This comparison is educational and is not a recommendation to buy or sell any stock. Prices change daily, and we update these figures after each quarterly result.