HUBC vs KAPCO vs NPL vs NCPL: Best Power Stock 2026
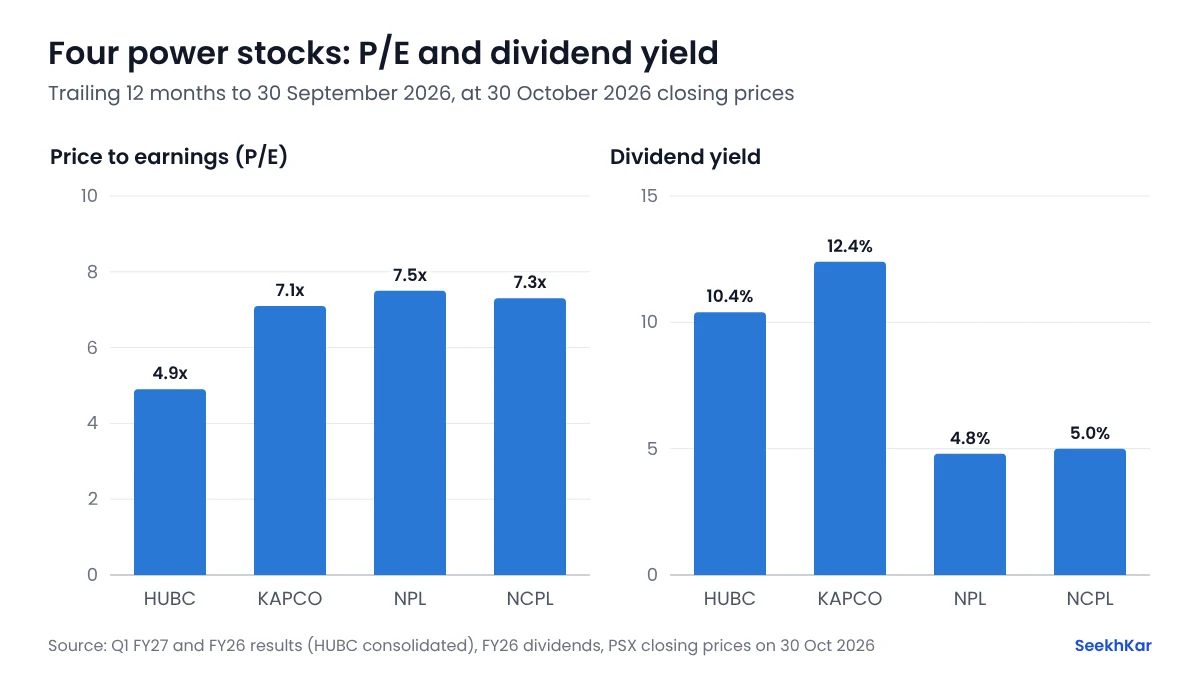
On 30 October 2026 prices, Hub Power (HUBC) and KAPCO tie on our scorecard. HUBC has the lowest P/E, 4.9 times, a 21.6% ROE and a 10.4% dividend yield. KAPCO trades at 0.38 times book value and yields 12.4%, but earns a 5% ROE and paid more in FY26 dividends than it earned.
Key takeaways
- Hub Power and KAPCO tie at 13 points on our six-measure scorecard (lower is better); Nishat Chunian Power scores 15 and Nishat Power 18.
- Hub Power earned Rs 9.86 a share in Q1 FY27, up 10%. Its Rs 12.7 billion share of profit from associates and joint ventures was larger than its own gross profit of Rs 8.0 billion.
- KAPCO's profit rose to Rs 500 million from Rs 5 million after its new power purchase agreement took effect in September 2025, but its receivables more than doubled to Rs 15.4 billion in the quarter.
- Nishat Power and Nishat Chunian Power now sell under a hybrid take-and-pay tariff: revenue rose about fivefold as their plants ran more, while profit was flat to lower.
- KAPCO paid Rs 3 a share for FY26 against EPS of Rs 2.86, so its 12.4% yield is not covered by earnings. Hub Power paid out about half of its FY26 earnings.
PSX retail investor
M Zubair is a retail investor on the Pakistan Stock Exchange. He writes SeekhKar's guides to explain the basics of investing, such as reading annual reports, P/E ratios, dividends and valuation, in simple language for new PSX investors. Everything here is for learning, not investment advice.
HUBC vs KAPCO vs NPL vs NCPL: Valuation at a Glance
Hub Power (HUBC), Kot Addu Power (KAPCO), Nishat Power (NPL) and Nishat Chunian Power (NCPL) are the four independent power producers (IPPs) in the KSE-100 index; Nishat Chunian joined it on 1 October 2026. The two Nishat companies belong to the same group and sell power on the same terms. All four end their financial year on 30 June, so their results for the quarter ended 30 September 2026 (Q1 FY27) cover the same period. Prices are PSX closing prices on 30 October 2026.
Earnings are trailing twelve months (TTM): FY26 EPS, minus Q1 FY26, plus Q1 FY27. Dividends are each company's dividends for FY26.
| Metric | HUBC | KAPCO | NPL | NCPL |
|---|---|---|---|---|
| Share price, 30 Oct 2026 | Rs 193.18 | Rs 24.17 | Rs 51.80 | Rs 49.60 |
| Market capitalisation | Rs 251 bn | Rs 21.3 bn | Rs 18.3 bn | Rs 18.2 bn |
| EPS, Q1 FY27 | Rs 9.86 | Rs 0.57 | Rs 1.53 | Rs 1.52 |
| EPS, TTM | Rs 39.16 | Rs 3.42 | Rs 6.89 | Rs 6.77 |
| P/E, TTM | 4.9x | 7.1x | 7.5x | 7.3x |
| Book value per share, 30 Jun 2026 | Rs 181.42 | Rs 63.88 | Rs 83.69* | Rs 68.47 |
| P/B | 1.06x | 0.38x | 0.62x | 0.72x |
| ROE (TTM EPS ÷ book value) | 21.6% | 5.4% | 8.2% | 9.9% |
| Dividend per share, FY26 | Rs 20.00 | Rs 3.00 | Rs 2.50 | Rs 2.50 |
| Dividend yield | 10.4% | 12.4% | 4.8% | 5.0% |
| EPS growth, Q1 FY27 vs Q1 FY26 | +10% | From Rs 0.01 | −7% | +1% |
| Total debt ÷ equity, 30 Jun 2026 | 0.28x | 0.38x | 0.13x* | 0.13x |
Hub Power's figures are consolidated, and its book value excludes the part of its subsidiaries owned by other shareholders. Book values, debt and receivables are from S&P Global data. *Nishat Power's book value and debt are at 31 March 2026, because its 30 June 2026 balance sheet was not yet in that data.
Which Power Stock Is Cheapest?
Hub Power on earnings, KAPCO on book value. Hub Power trades at 4.9 times trailing earnings, against 7.1 to 7.5 times for the other three. It is the only one priced above its book value, at 1.06 times, because it earns far more on that book: a 21.6% ROE. Our guide to P/E ratios by sector explains how to read these multiples.
KAPCO trades at 0.38 times book value, the lowest of the four, and the two Nishat companies at 0.62 and 0.72 times. A price far below book value usually means the market doubts the assets will keep earning. KAPCO earned a 5.4% return on its book value over the last twelve months. The renewal it announced in February 2025 covers 500 MW of its 1,600 MW plant for three years, and NEPRA's power acquisition plan needs the plant only until 2027, according to KAPCO's notice to the PSX.
Hub Power is now mainly a holding company. In the quarter its share of profit from associates and joint ventures, such as China Power Hub Generation's coal plant at Hub, was Rs 12.7 billion, more than its own gross profit of Rs 8.0 billion. Its original 1,292 MW oil-fired plant at Hub no longer sells power: its agreement ended early in October 2024.
Q1 FY27 Results: Why Did Revenue Jump?
| Quarter ended 30 Sep | Revenue, 2026 | Revenue, 2025 | Profit after tax, 2026 | Profit after tax, 2025 | Change in profit |
|---|---|---|---|---|---|
| Hub Power (group) | Rs 22.11 bn | Rs 17.40 bn | Rs 14.62 bn | Rs 13.28 bn | +10% |
| KAPCO | Rs 11.72 bn | Rs 4.16 bn | Rs 499.8 m | Rs 4.9 m | About 100x |
| Nishat Power | Rs 8.25 bn | Rs 1.67 bn | Rs 541.4 m | Rs 584.3 m | −7% |
| Nishat Chunian Power | Rs 7.01 bn | Rs 1.37 bn | Rs 558.3 m | Rs 552.1 m | +1% |
The plants ran much more. Revenue rose about fivefold at both Nishat companies and 2.8 times at KAPCO. Nishat Chunian's 200 MW plant burns furnace oil, and Pakistan's furnace oil sales to power plants rose more than fivefold in the same quarter, as our PSO vs APL comparison shows. Most of the extra revenue went on costs: Nishat Power's cost of sales was Rs 7.73 billion out of Rs 8.25 billion of revenue, so profit grew far less than revenue.
Hub Power grew on its investments. Net revenue rose 27% to Rs 22.1 billion, finance costs fell 13% to Rs 2.2 billion and its share of associates' profit rose 18%. Tax rose 51% to Rs 4.8 billion. The board declared a Rs 5 interim dividend.
KAPCO swung back to a gross profit. It made a gross profit of Rs 38.8 million, against a gross loss of Rs 831 million a year earlier, and other income of Rs 922 million was larger than its whole profit. Its finance cost rose to Rs 427 million from Rs 5 million as its borrowings grew while unpaid bills built up.
The Nishat companies earned less on the side. Nishat Power's gross profit rose 32% to Rs 516 million, but its other income fell to Rs 113 million from Rs 436 million. Nishat Chunian's gross profit fell 8% to Rs 402 million; a Rs 210 million share of an associate's profit, against nothing a year earlier, kept its profit flat.
New Power Contracts and Circular Debt
Until 2024 most IPPs received capacity payments for keeping their plants available, whether or not the grid used them. In 2024 and 2025 the government renegotiated these contracts to lower the cost of electricity, and each of these companies is on new terms:
- Nishat Power and Nishat Chunian Power are two of seven IPPs whose revised agreements moved to a hybrid take-and-pay tariff from November 2024: part of the return on equity is paid only for electricity the grid actually buys. They also agreed to share profits earned up to FY23 and to waive late payment charges up to October 2024. Both booked large charges for this in FY25, and their book values per share fell about a fifth in the December 2024 quarter.
- KAPCO signed a tripartite agreement with CPPA-G, the government's power buyer, and the national grid company. It took effect on 13 September 2025, near the end of the July-September quarter in which KAPCO earned only Rs 4.9 million.
- Hub Power's original Hub plant agreement ended early in October 2024, with the government agreeing to settle its receivables up to 1 October.
The deals cleared old receivables: the government paid Nishat Power Rs 9.63 billion and Nishat Chunian Rs 6.67 billion, and their receivables fell from Rs 14.4 billion and Rs 13.2 billion in June 2024 to under Rs 2 billion each a year later. Now that the plants run more, unpaid bills are building up again.
| Company | Receivables, 30 Jun 2025 | Latest receivables | Latest ÷ market value |
|---|---|---|---|
| Hub Power (group) | Rs 29.0 bn | Rs 32.4 bn 30 Jun 2026 | 13% |
| KAPCO | Rs 3.4 bn | Rs 15.4 bn 30 Sep 2026 | 72% |
| Nishat Power | Rs 1.7 bn | Rs 2.5 bn 31 Mar 2026 | 14% |
| Nishat Chunian Power | Rs 1.5 bn | Rs 5.5 bn 30 Jun 2026 | 30% |
KAPCO is the clearest case. Its receivables more than doubled from Rs 7.0 billion on 30 June to Rs 15.4 billion on 30 September 2026, equal to 72% of its market value, and its borrowings reached Rs 16.5 billion, from none a year earlier. This is circular debt: the power buyer pays late because electricity bills are not fully collected, and the producer borrows to fill the gap.
Which Pays the Higher Dividend?
| Company | FY26 dividend | Yield | Yield after 15% tax | Payout of TTM EPS |
|---|---|---|---|---|
| KAPCO | Rs 3.00 | 12.4% | 10.6% | 88% |
| Hub Power | Rs 20.00 | 10.4% | 8.8% | 51% |
| Nishat Chunian Power | Rs 2.50 | 5.0% | 4.3% | 37% |
| Nishat Power | Rs 2.50 | 4.8% | 4.1% | 36% |
KAPCO paid a Rs 1.50 interim and a Rs 1.50 final dividend for FY26, Hub Power four payments of Rs 5, and each Nishat company a Rs 1.50 interim and a Re 1 final.
KAPCO yields the most, Hub Power more safely. At 30 October prices, Rs 100,000 in KAPCO would have earned about Rs 10,550 over the last year after the 15% withholding tax for filers, and about Rs 8,800 in Hub Power. But KAPCO's Rs 3 for FY26 was more than its FY26 EPS of Rs 2.86, and its cash fell to Rs 1.3 billion at 30 September, so the payout depends on collecting its receivables. Hub Power paid out about half its earnings and has declared a first Rs 5 interim dividend for FY27.
The Nishat companies pay out about a third of their earnings, so their yields are lower but better covered. Some dividends from power producers are taxed at 7.5% for filers instead of 15%, where the dividend is a pass-through item under the plant's power purchase agreement; your dividend statement shows the rate withheld. The dividend calculator works out your income after tax, and our guide to dividend investing in Pakistan explains how to check whether a payout can last.
Scorecard: Which Power Stock?
We ranked the four companies 1 (best) to 4 on six measures, with equal weight. A lower total is better. Nishat Power and Nishat Chunian Power tie on debt.
| Company | P/E | P/B | Dividend yield | ROE | EPS growth | Debt | Total |
|---|---|---|---|---|---|---|---|
| Hub Power | 1 | 4 | 2 | 1 | 2 | 3 | 13 |
| KAPCO | 2 | 1 | 1 | 4 | 1 | 4 | 13 |
| Nishat Chunian Power | 3 | 3 | 3 | 2 | 3 | 1 | 15 |
| Nishat Power | 4 | 2 | 4 | 3 | 4 | 1 | 18 |
- Earnings and dividends: Hub Power. The lowest P/E, the highest ROE and a 10.4% yield covered about twice by earnings. The risk is that most of its profit comes from associates it does not fully control, such as China Power Hub Generation.
- Deep value and the highest yield: KAPCO. 0.38 times book value and a 12.4% yield. Its growth rank flatters it, since Q1 FY26 earned almost nothing, and the risks are a 5% ROE, a dividend larger than its earnings, receivables equal to 72% of its market value and a contract for only part of the plant.
- Low debt: Nishat Chunian Power and Nishat Power. Little debt and receivables cleared in 2025, but returns of 8-10% on book value and lower yields, with profit that now depends on how often the grid runs their plants.
Why not K-Electric? K-Electric (KEL), the fifth power stock in the KSE-100, is not an IPP: it generates, transmits and distributes electricity in Karachi, so its profit depends on its NEPRA tariff and on collecting customers' bills, and these measures do not compare like with like. Its results have also come out late: its accounts for the year to June 2024 were approved only in September 2025.
Our power generation sector guide lists the other numbers to check, such as plant availability and receivables. This comparison is educational and is not a recommendation to buy or sell any stock. Prices change daily, and we update these figures after each quarterly result.
Sources & Further Reading
- Mettis Global: HUBC 1QFY27 profit climbs 10%
- Mettis Global: KAPCO's profit jumps over 100 folds in 1QFY27
- Mettis Global: Nishat Power 1QFY27 profit falls 7% to around Rs541m
- Mettis Global: NCPL profit remains steady at Rs558m in 1QFY27
- Profit by Pakistan Today: seven IPPs, including Nishat Power and Nishat Chunian, move to hybrid take-and-pay tariffs